Graham Potter's problem with blocked shots
How blocked shots helped spell his downfall at Chelsea

In April, Graham Potter was sacked as Chelsea manager after just six disappointing months in charge. His time at Chelsea appears a mile away from his previous experiences of management. Before Chelsea, his management journey appeared a fairy tale. Seven hugely successful years at Ostersund SK in Sweden and four years of impressive performance at Brighton had earned him the Chelsea job. However, some of the issues his Chelsea team faced were familiar to his previous teams.
Potter’s Brighton side was particularly popular amongst football statheads as it performed well on expected goals (xG), a metric which measures how many goals you would expect an average team to score based on the quality of their chances.
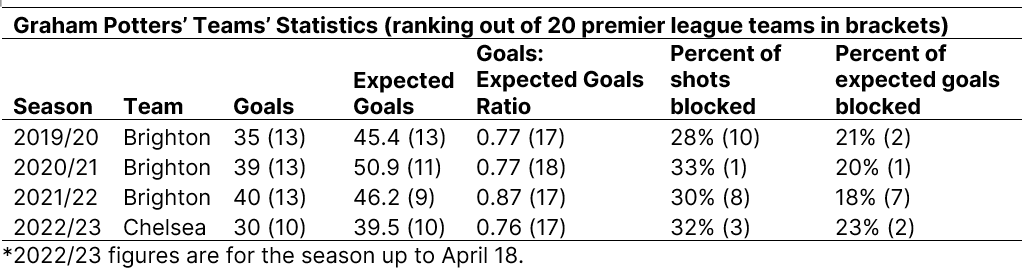
But his teams have had a problem. Every year since 2019/20 Graham Potter’s teams have scored fewer goals than you would expect them to, based on the estimated quality of their chances. In both 2019/20 and 2020/21 his teams scored only 77 percent of their expected goals. In his time at Chelsea, the same problem followed him. This season Chelsea have scored only 76 percent of their expected goals.
A key reason for this underperformance is blocked shots. In each of the last four seasons, Graham Potter’s teams were at the top of the league for the percentage of shots blocked and the percentage of the expected goals blocked. In his season as Chelsea manager, 32 percent of their shots were blocked, equivalent to 23 percent of their expected goals.
But maybe Potter’s teams have been unlucky? Does a team really have control over how many of their shots are blocked? Even though it has happened four seasons in a row, maybe Potter’s teams have had a bad run of luck in terms of getting their shots blocked.
There is some random variation in the percent of shots blocked a team has, but there is also considerable persistence. The graph below shows this. Teams who have a high share of their expected goals blocked in one season are more likely to have a high share of their expected goals blocked in the next season.

There is also a persistent (if fairly weak) relationship between having shots blocked and overall underperformance on expected goals. If a team has a high share of their expected goals blocked, they are more likely to underperform their expected goals overall, both this year and also next year.

Together, this suggests that there is some signal here rather than just noise.
So why have Graham Potter’s teams had so many shots blocked?
One explanation for blocked shots could be the distance of the shots. Shots taken from further away tend to be more easily blocked as there’s more time for defenders to get themselves in front of the shot. But this doesn’t seem to explain it. Potter’s team shoot at a similar average distance from goal than the rest of the league. The graph below shows that Potter’s team are more likely to have their shots blocked across any distance from goal.

My theory is that Graham Potter’s teams’ attacking style makes it easier for opponents to block their shots. Potter’s teams build up slowly, allowing opponents time to get players behind the ball. With more players behind the ball, it is easier to block a shot. While Expected Goals models try and account for this, there are a lot of factors which affect the chance of a shot being blocked and it is difficult to account for all of them.
Consider the example of this shot taken by Kovacic when Chelsea were playing Everton earlier in the year. He shoots from the edge of the box with three players directly in between him and the goal. I’ve used expected goals estimates from Opta in this article. Opta’s model adjusts for any player in the triangle between the shooter and the goalpost. In this case, the three opposition players in a line directly between Kovacic and the goal. This combined with the distance of the shot means it assigns the shot a relatively low chance of going in (0.04).

However, based on public information about their xG model it does not seem they account for the other four Everton players standing near Kovacic. One of these players is Tarkowski, who dives across the ball’s path to block Kovacic’s shot.
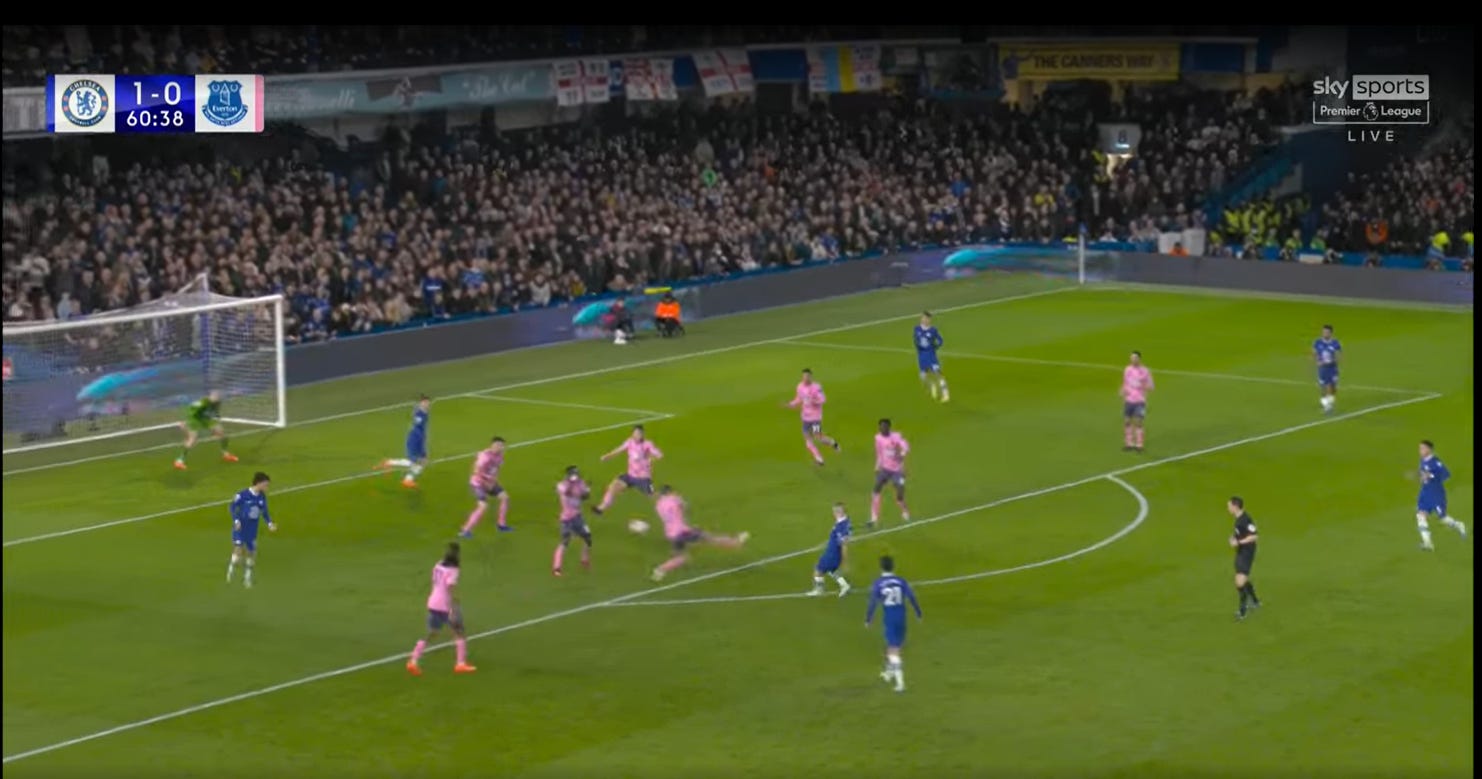
So, a player who started outside of the path of the ball to the goal ends up stopping the shot. This is hard for a probability model to account for (although some xG models do try and do this. If the model does not properly account for players who aren’t immediately between the shooter and the goal, then it may overestimate the chance of shots like this being scored.
This season, Chelsea have tended to shoot in more crowded boxes than other teams. If expected goals models overestimates the value of these types of shots, this may help explain why Potter’s teams have performed so poorly against their expected goals numbers.
This is only one theory though and questions still remain. Why have Potter’s teams underperformed their expected goals while other teams who also shoot into crowded boxes (such as Arsenal) have not? Are some players better at shooting into crowded spaces? What tweaks could Potter make when he returns to management to overcome these issues? Plenty of things for him to reflect on in his time off.