

Do teams matter in the NBA?
Switching teams can be make or break for basketball players

It’s 2011, Lamar Odom has just come off a career year with the Lakers, winning the Sixth Man of the year award. He had just launched his own reality TV show with Khloe Kardashian and had shown he could balance reality TV life with playing basketball at the highest level. Everything was looking up, then he got traded to the Mavericks.
The Mavericks had just come off a title-winning season, so at first glance they could have been a good destination for Odom. But Odom is clear now, it was not a good move for him. He said “That trade from the Lakers basically ended my career and purpose. I was never really myself ever again.”
His numbers on the court fell off drastically. In 2010/11 he was an efficient scorer. His true shooting percentage of 59%, a measure of overall shooting accuracy, was equal to stars such as Pau Gasol and Kevin Durant. In 2011/12 his true shooting percentage fell to a below par 42%. According to Fivethirtyeight’s RAPTOR metric, he went from boosting his team’s performance by 3 points per 100 possessions in 2010/11 to being worth -3.6 per 100 possessions in 2011/12 with the Mavericks.
Now consider Nate Robinson. In 2010/11 he had a dud year. He played 55 games for the Celtics. He was a below average player at Boston both with and without the ball. His true shooting percentage of 51% was below league average and he was a liability on defense. According to RAPTOR, he made his team -2.4 points worse off each 100 possessions. He was traded to OKC, who played him for 4 games and waived him.
But then he was picked up by Golden State. Golden State needed a backup point guard to the rising star Steph Curry and they took a punt on Robinson. Playing for Golden State in 2011/12, Robinson looked a different player. He shot better, with an above average true shooting percentage of 53%. He became a much more effective facilitator, with his assists per game rising from 1.5 in Boston to 4.5 in Golden State. He was now an asset, adding 1.9 points per 100 possessions.
These two contrasting stories show how drastically player performance can change after switching teams. In the era of advanced stats there is a tendency to quantify individual performance and look at a team as a sum of individual parts. But if individual performance can vary so much following trades, it raises the question whether individual performance is actually a function of team chemistry and roles rather than individual ability? If so what elements of performance are most affected by a player’s team?
To explore these questions systematically, I have used data on how performance changes year-on-year. If teams matter, then we’d expect performance to vary more year-on-year for players who switch teams than players who remain at the same team.
The graph below shows Raptor +/- in consecutive seasons for players with a minimum of 700 minutes per season from 2000-2019. A positive Raptor score of 1 means you add 1 point per 100 possession, a score of -1 means you make your team 1 point worse per 100 possessions. If players are on the 45 degree line, they perform equally well both seasons. If they are below they performed worse in season t than in season t-1, and if they are above they performed better in season t than in season t-1.

If teams matter, we’d expect players who switch teams to be further away from the line on average. Individual performance is more likely to change after switching teams. Either they underperform expectations like Odom or overperform like Robinson. It’s hard to see a relationship visually. There are also other factors that might affect year-on-year change in performances, so we need to dig a bit deeper.
To test things more robustly, I used a regression to estimate the effect of being traded on the absolute year-on-year difference in performance across a range of metrics. I look at the absolute difference, as it measures volatility independent of whether a player gets worse or better. I control for other factors that could confound the estimates: these are minutes played, age and individual dummies. I’ve put more detail on the regression in a methodology note at the bottom of the page.
The results are presented below, with 95% confidence intervals. I have standardised the results, so they are comparable between metrics.

Three interesting results stand out. Firstly, it is clear that teams matter. For almost all metrics of performance, switching teams makes your performance more volatile. But the effects are small. On average a player’s RAPTOR +/- changes by 1.75 points per 100 sessions between seasons. Switching teams increases the average absolute change in RAPTOR +/- by 0.14 per 100 possessions. So switching teams does make a player’s performance more volatile, but the majority of the volatility is due to other factors. Some of this volatility will be due to changes in individual ability, but its worth noting that between seasons there will also be changes to a given team e.g. new players, new coaches. So some of the volatility for players who remain on the same team, will also be due to changes in their circumstances.
Secondly, there are the largest effects for the metrics which depend most on team roles. Usage percentage, which measures what percentage of a team’s possessions a player uses (e.g. by shooting), is most affected by switching teams. This is intuitive, usage is to a large extent determined by a team’s coach and other players on the team. A player who switches from a team with a lot of ball hungry players, to a team without many is likely to see a large change in usage.
More interestingly assist and turnover rates are also likely to change considerably following a team switch. Switching teams on average changes a players’ assist rate by 1.1 percentage points and turnover rate by 0.3 percentage points. The amount an individual player handles the ball is again highly dependent on a team’s tactics and alternative ball carriers. Unlike usage rate, players are often given credit for having a lot of assists. These results suggest we should be more cautious in crediting players for their assists.
Finally, 3 point shooting and free throw shooting seem to be unaffected by getting traded. It’s no surprise that free throw shooting is unaffected, as it is a purely individual activity, but its more surprising that 3 point shooting is unaffected, while 2 pointers are. Good 3 point shooters, remain good shooters independent of their team. This might be because the difficulty of 3 point shooting varies less based on the type of shot. Putting away an open layup is much easier than taking a contested 2 point jumper, but an assisted 3 pointer is not that much easier than an unassisted 3 pointer. Whatever the reason, if I was a GM, I would value players with a proven track record of hitting 3s.
Thanks to everyone at Fivethirtyeight for compiling the data used in this article. You can access the data here and code for this article here. I’d love to hear any views/feedback, I’m considering doing similar analysis for football and baseball.
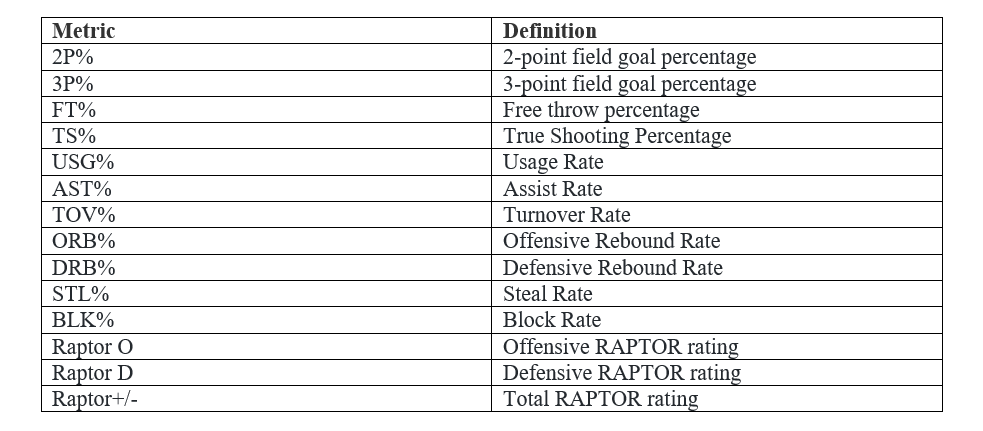
Performance Metrics:
More information on all but the RAPTOR metrics is available here.
More information on the RAPTOR metrics are available here. I use the historical version of RAPTOR as it allows comparisons over longer time period. There is a more detailed version available from 2013-14.
Methodology note:
This section briefly explains the technical detail of how I’ve got to the estimates above. Only read if you’re interested in the econometrics behind the estimates, as I use some technical language below.
In the above article, I estimate whether switching teams affects the volatility of a basketball player’s performance on different metrics. I hypothesise that after switching teams a player’s performance is more likely to change.
The estimated coefficients come from the fixed effects regression with the following equation:

Where Y is the performance of player i on metric Y in period t, so the independent variable is the absolute difference in Y between season t and season t-1. This is a measure of volatility in performance. I standardise the independent variable, so we can compare effects across metrics. I do this by subtracting the independent variable’s mean from it and then dividing by its standard deviation.
Switched Teams is a dummy that is 1 If a player switched teams between season t and season t-1. δ is the key coefficient, which shows the effect of being traded on the volatility of performance.
α is the player specific fixed effect. I include this to control for the fact that some players may be more inherently volatile performers. If teams don’t like volatile performers, then this may lead to reverse causality where players are traded because they are more volatile. Assuming a player’s volatility is fixed across time, including the fixed effect removes this issue.
Xti is a vector of controls which includes:
· Minutes in season t
· Minutes in season t-1
· Rounded age dummies, in five year age brackets.
I include minutes in both seasons, as performance is likely to be more volatile for players who play less minutes in a given season. If you play less minutes, there is a smaller sample size and therefore players are more likely to over/underperform their true ability. I also include age dummies as you might expect performance changes more between seasons at the beginning and end of player’s careers. At the beginning a player’s career they are likely to be improving towards their peak, while older players are likely to be falling off their peak.